Register Time Series Data
Choose how to bring your CSV files into Encord: register files from private cloud storage, sync a cloud folder, or upload local files to Encord storage.Private Cloud Import
Register CSV files with thetime_series top-level key in your upload JSON. This example registers accelerometer readings from a robot arm performing a pick-and-place task and configures the X-axis channel as a blue line.
Time series upload JSON
settings object is optional. Channel keys match the CSV headers; channels without settings use the default appearance.
Then register the JSON file through the existing data registration flow:
See Time Series Customization to configure channels during registration, update settings with the SDK, or change their appearance in the editor.
Cloud-Synced Folder
Use a Cloud-synced folder to register time series CSV files from a cloud storage path and pick up new files when the folder syncs.- Create a cloud integration with access to your files.
- In Data > Files & Folders, select New folder > Cloud-synced folder.
- Select the integration and enter the storage path containing your CSV files, then click Create.
- Resync the folder manually when files change, or enable Automatically sync data for daily updates.
text/csv or application/csv content type in cloud storage. To customize channels after registration, use the SDK or editor controls.
Encord Storage (UI and SDK)
Upload local CSV files to an Encord folder using either the UI or the SDK:- UI: In Data > Files & Folders, click Upload files, select a destination folder, and drag your CSV files into the Upload tab. Click Upload to finish. See Upload Local Data.
- SDK: Call
upload_time_series()on your destinationStorageFolder. You can pass optional channel settings with the upload. See Time-series Data (SDK) for client setup and a complete example.
Upload a CSV to Encord storage
Time Series Column Structure
Encord supports CSV files for standalone time series data. Each file must contain a header row, one timestamp column, and at least one channel column. See Timestamp column for how Encord picks and interprets the timestamp column.Example
Timestamp column
Encord picks the timestamp column as follows:- The timestamp column is the first column whose header is
t,time, ortimestamp, or starts with one of these followed by_or-(for exampletime_msortimestamp-utc). Matching is case-insensitive. - If no header matches, Encord uses the first column as the timestamp column.
- Every other column is treated as a channel and plotted in the editor. Channel headers must be unique.
- Empty,
NaN,null, or otherwise non-numeric channel values are treated as gaps. - Rows without a valid timestamp are skipped.
Timestamp units
Encord infers the timestamp unit from the suffix of the timestamp column header:
If the header has no recognized suffix, Encord looks at the values. Clock values such as
00:01:23.500 are read as elapsed time, and ISO 8601 date-times are read as ISO timestamps. Any other numeric values are treated as frame indices on the timeline.
Unit-based timestamps (nanoseconds through ISO) are measured relative to the first valid row of the CSV. The first row always lines up with the start of the timeline, whatever its absolute value. ISO timestamps are read with millisecond precision.
Common Issues
Annotating Time Series Data
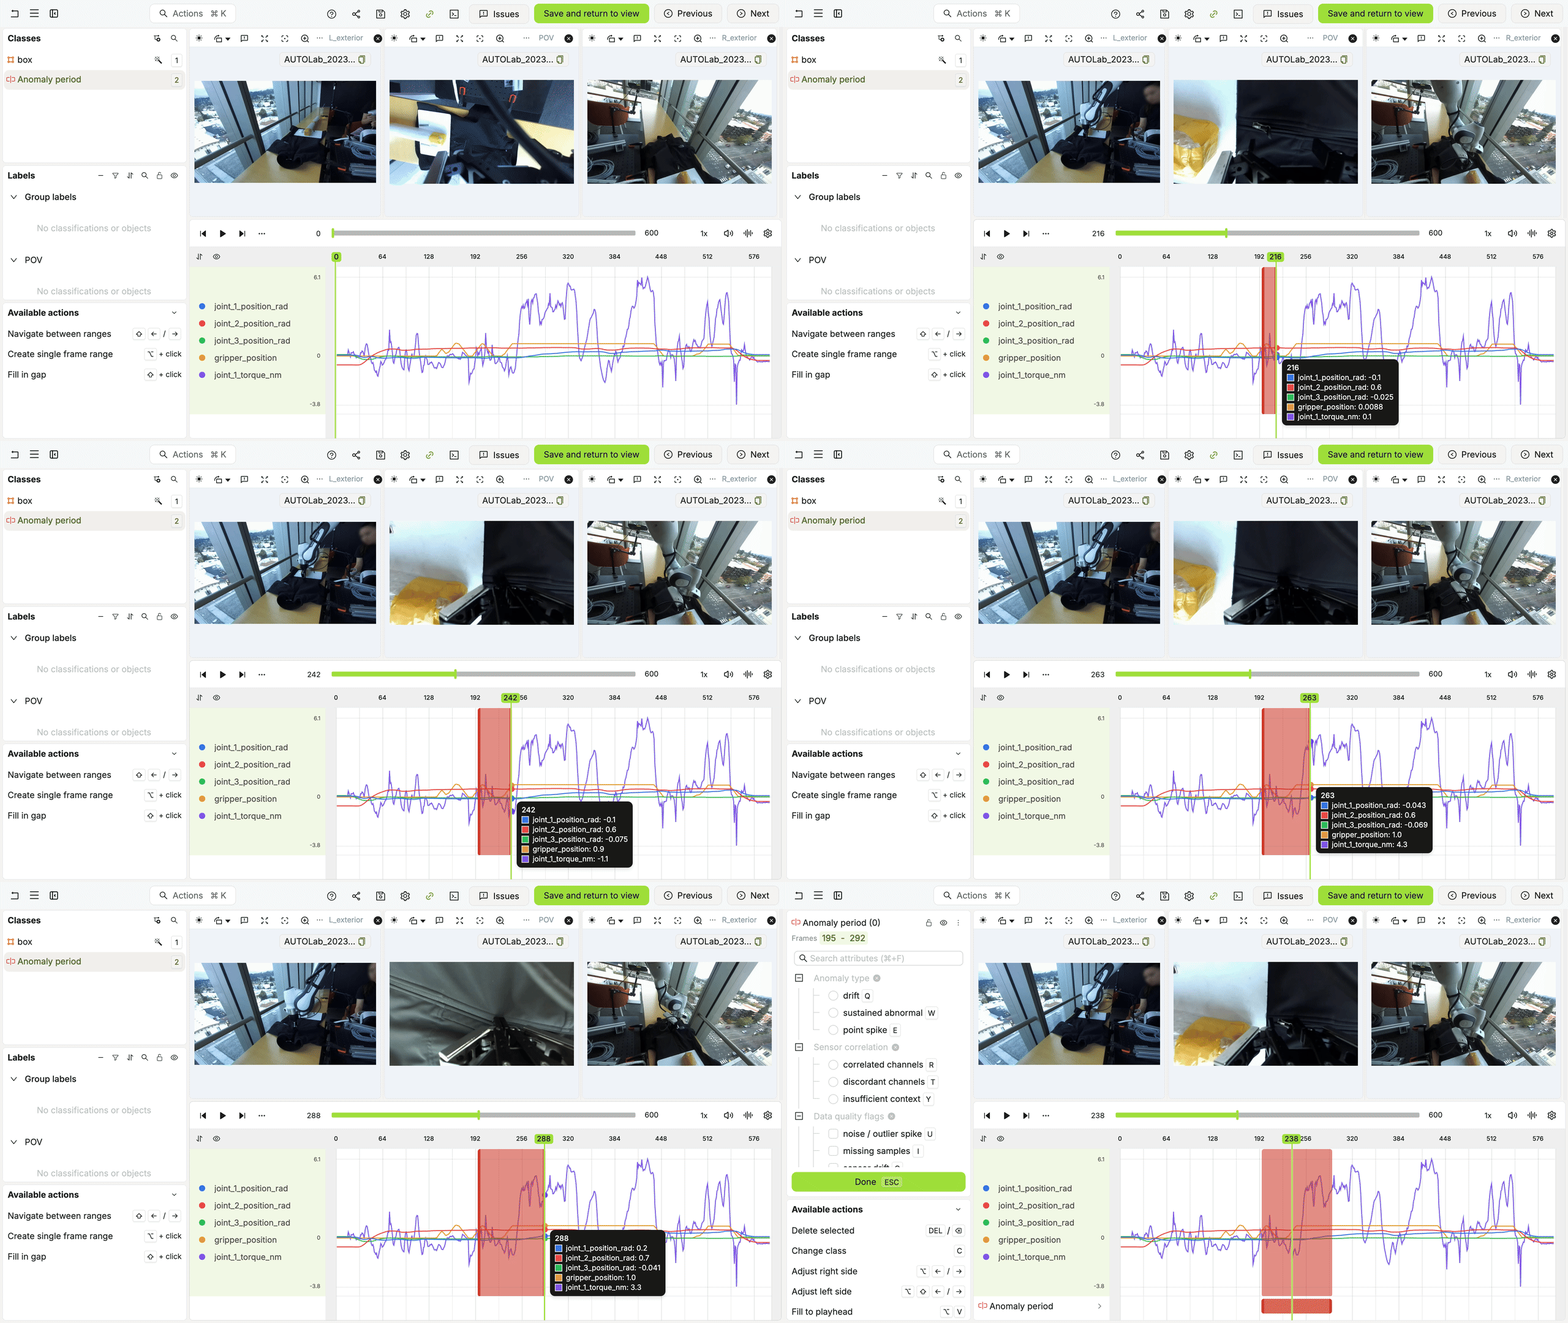
Add a Time range object to your Ontology, then open a time series task in the Label Editor.- Select the Time range class.
- Drag across the chart to mark an interval.
- Select the range to adjust its boundaries and fill in its attributes in the left sidebar.
Open Visualization using the waveform icon next to the settings cog in the playback toolbar. Enable Show tooltip to inspect channel values while hovering over the chart.
Time Series in Data Groups
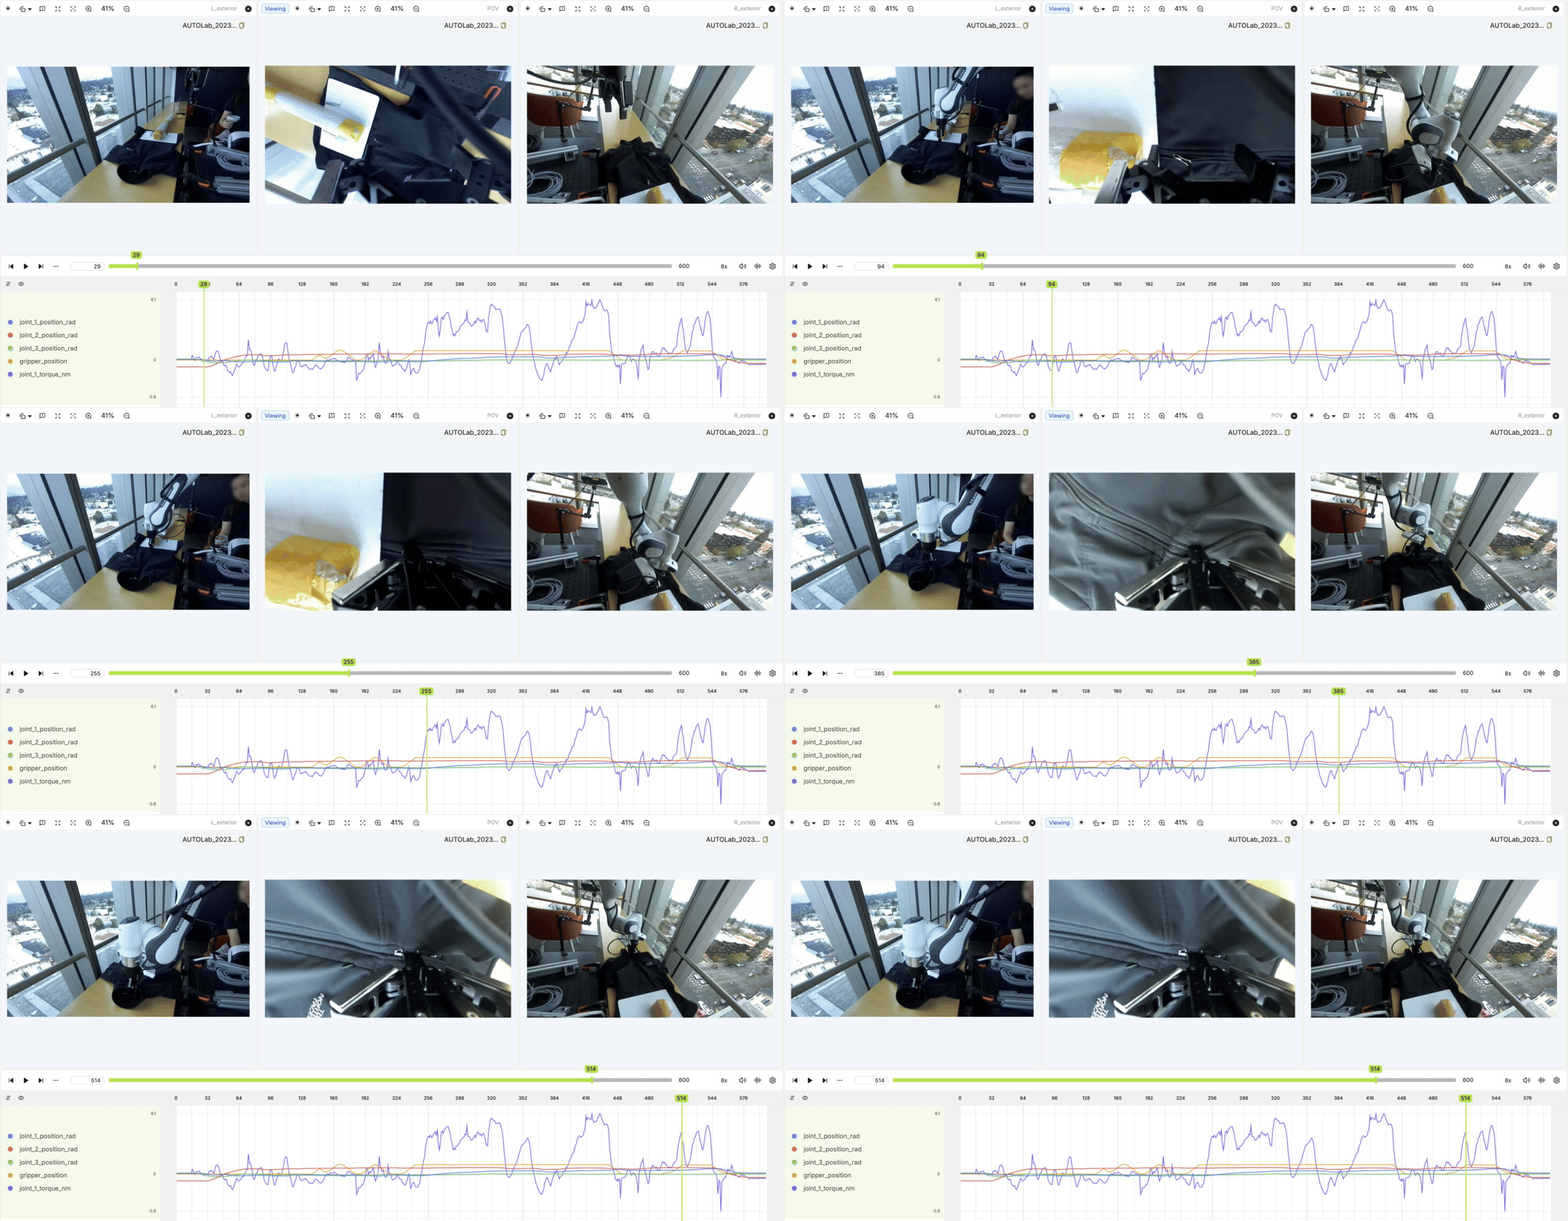
A Data Group layout can show a time series file in a layout tile tile, or in the shared timeline. The chart stays synchronized with the group’s frame navigation and displays the current frame cursor. Scroll to pan the chart. To zoom, hold Ctrl (Windows) or Command (macOS) while scrolling, or pinch on a trackpad. You can also create and edit time range labels directly in the tile.Time series in the timeline
Time series in chart tiles
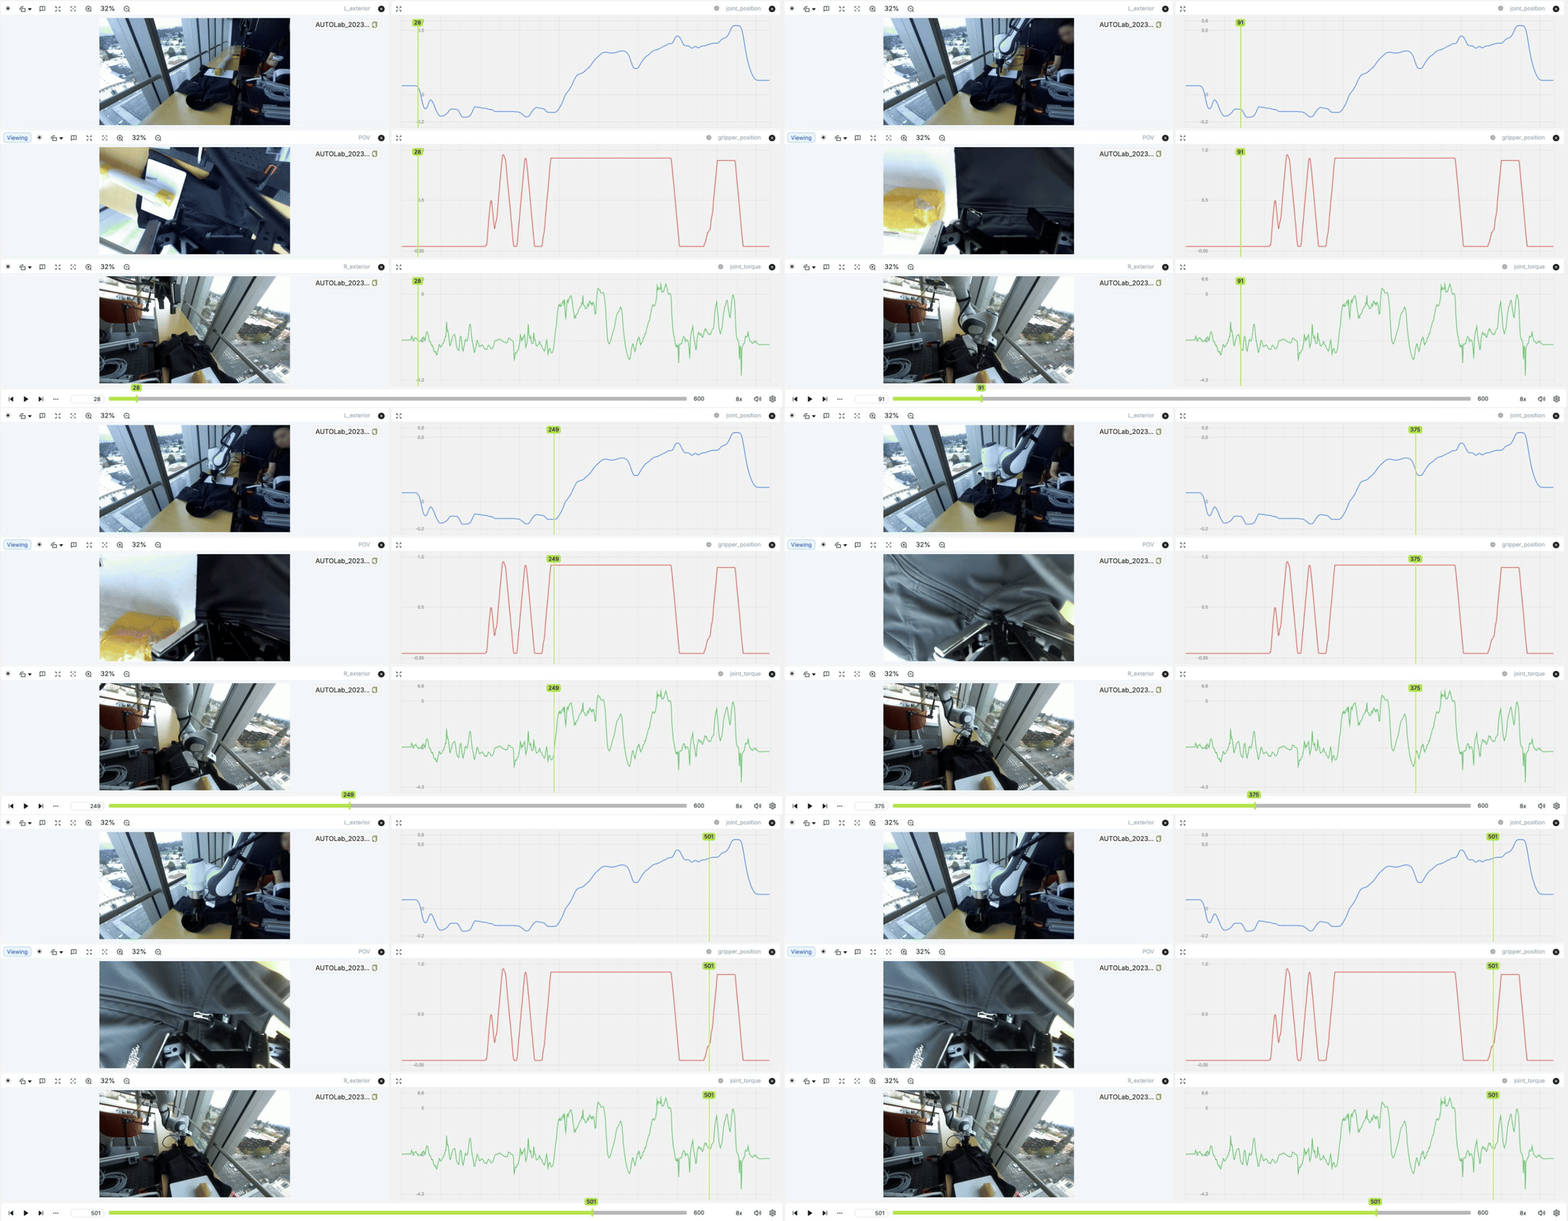
Both layouts keep the camera views and telemetry synchronized as you scrub through the Data Group.
Aligning Time Series with Videos
When a Data Group contains timeseries and videos, index the time series by video frame rather than by time:- Make the frame column the first column of the CSV and give it a header without a unit suffix, such as
frame. - Set each value to the video frame the sample belongs to, starting at
0for the first video frame.
1.5 sits halfway between frames 1 and 2, so data sampled faster than the video frame rate keeps its position.
To convert timestamps to frame indices, multiply the time in seconds since the start of the video by the video frame rate:
Frame-indexed time series for a 30 fps video
Time Series in Composite Scenes
Attach a time series CSV stream when you create and register a Composite Scene. For example, combine a LiDAR stream and a telemetry CSV:Composite Scene with time series
Time Series in MCAP Files
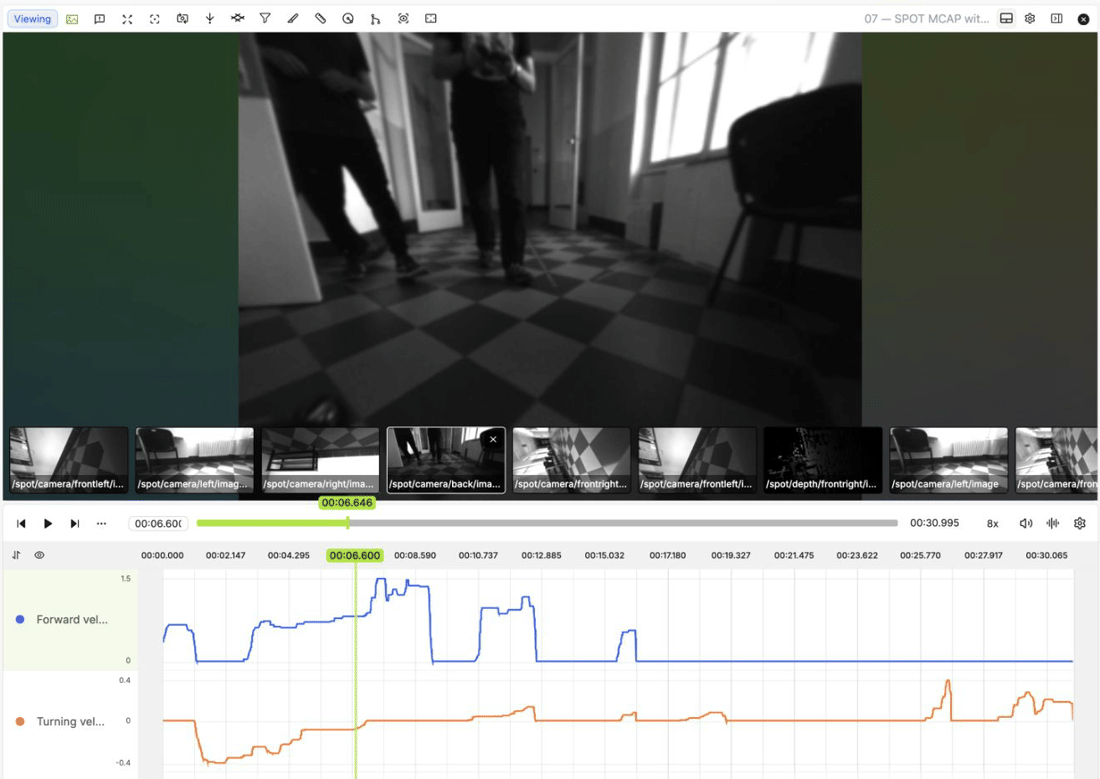
MCAP files can contain camera, 3D, and numeric telemetry channels in one recording. Use a Scene layout to select numeric sub-channels and place them in the timeline or separate chart tiles. The example below shows a robot camera view alongside forward and turning velocity charts at the same point in an MCAP recording. See MCAP Support for registration and Time Series in Scenes for the layout and labeling workflow.