Model quality metrics help you evaluate your data and labels based on a trained model and imported model predictions.Documentation Index
Fetch the complete documentation index at: https://docs.encord.com/llms.txt
Use this file to discover all available pages before exploring further.
Acquisition functions
Acquisition functions are a special type of model quality metric, primarily used in active learning to score data samples according to how informative they are for the model and enable smart labeling of unannotated data.| Title | Metric Type | Data Type |
|---|---|---|
| Entropy - Rank images by their entropy. | image | |
| LeastConfidence - Rank images by their least confidence score. | image | |
| Margin - Rank images by their margin score. | image | |
| Variance - Rank images by their variance. | image | |
| MeanObjectScore - Rank images by their average object score | image | object |
Entropy
Rank images by their entropy. It can be employed to define a heuristic that measures a model’s uncertainty about the classes in an image using the average of the entropies of the model-predicted class probabilities in the image. Like before, the higher the image’s score, the more “confused” the model is. As a result, data samples with higher entropy score should be offered for annotation.Metric details
The mathematical formula of entropy is: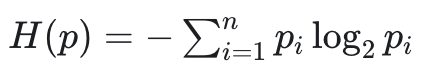
Least Confidence
Rank images by their least confidence score. Least confidence takes the difference between 1 (100% confidence) and the most confidently predicted label for each item. It’s useful to convert the uncertainty scores to a 0–1 range, where 1 is the most uncertain score. It can be employed to define a heuristic that measures a model’s uncertainty about the classes in an image using the average of the LC score of the model-predicted class probabilities in the image. Like before, the higher the image’s score, the more “confused” the model is. As a result, data samples with higher LC score should be offered for annotation.Metric details
The mathematical formula of the LC score of a model’s prediction is: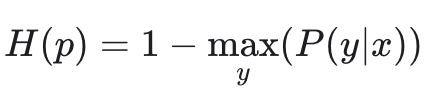
Margin
Rank images by their margin score. It can be employed to define a heuristic that measures a model’s uncertainty about the classes in an image using the average of the margin score of the model-predicted class probabilities in the image. Like before, the lower the image’s score, the more “confused” the model is. As a result, data samples with lower margin score should be offered for annotation.Metric details
Margin score of a model’s prediction is the difference between the two classes with the highest probabilities. The lower the margin score, the more “uncertain” the prediction. Implementation on GitHub.Variance
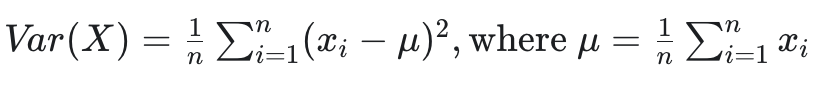
Rank images by their variance. It can be employed to define a heuristic that measures a model’s uncertainty about the classes in an image using the average of the variance of the model-predicted class probabilities in the image. Like before, the lower the image’s score, the more “confused” the model is. As a result, data samples with lower variance score should be offered for annotation.Metric details
The mathematical formula of variance of a data set is: