Label quality metrics operate on the geometries of objects like bounding boxes, polygons and polylines.Documentation Index
Fetch the complete documentation index at: https://docs.encord.com/llms.txt
Use this file to discover all available pages before exploring further.
Access Label Quality Metrics
Label Quality Metrics are used for sorting data, filtering data, and data analytics.| Title | Metric Type | Ontology Type |
|---|---|---|
| Absolute Area - Computes object size in amount of pixels. | image | bounding box, polygon, rotatable bounding box |
| Aspect Ratio - Computes aspect ratios of objects. | image | bounding box, polygon, rotatable bounding box |
| Blue Value - Ranks annotated objects by how blue the average value of the object is. | image | bounding box, polygon, rotatable bounding box |
| Brightness - Ranks annotated objects by their brightness. | image | bounding box, polygon, rotatable bounding box |
| Border Proximity - Ranks annotations by how close they are to image borders. | image | bounding box, point, polygon, polyline, rotatable bounding box, skeleton |
| Broken Object Tracks - Identifies broken object tracks based on object overlaps. | sequence, video | bounding box, polygon, rotatable bounding box |
| Brightness - Ranks annotated objects by their brightness. | image | bounding box, polygon, rotatable bounding box |
| Confidence - The confidence that an object was annotated correctly. | image | bounding box, polygon, rotatable bounding box |
| Contrast - Ranks annotated objects by their contrast. | image | bounding box, polygon, rotatable bounding box |
| Classification Quality - Compares image classifications against similar images. | image | radio |
| Green Value - Ranks annotated objects by how green the average value of the object is. | image | bounding box, polygon, rotatable bounding box |
| Height - Ranks annotated objects by the height of the object. | image | bounding box, polygon, rotatable bounding box |
| Inconsistent Object Class - Looks for overlapping objects with different classes (across frames). | sequence, video | bounding box, polygon, rotatable bounding box |
| Inconsistent Track ID - Looks for overlapping objects with different track-ids (across frames). | sequence, video | bounding box, polygon, rotatable bounding box |
| Label Duplicates - Ranks labels by how likely they are to represent the same object. | image | bounding box, polygon, rotatable bounding box |
| Missing Objects - Identifies missing objects based on object overlaps. | sequence, video | bounding box, polygon, rotatable bounding box |
| Object Classification Quality - Compares object annotations against similar image crops. | image | bounding box, polygon, rotatable bounding box |
| Occlusion Risk - Tracks objects and detect outliers in videos. | sequence, video | bounding box, rotatable bounding box |
| Polygon Shape Anomaly - Calculates potential outliers by polygon shape. | image | polygon |
| Randomize Objects - Assigns a random value between 0 and 1 to objects. | image | bounding box, polygon, rotatable bounding box |
| Red Value - Ranks annotated objects by how red the average value of the object is. | image | bounding box, polygon, rotatable bounding box |
| Relative Area - Computes object size as a percentage of total image size. | image | bounding box, polygon, rotatable bounding box |
| Sharpness - Ranks annotated objects by their sharpness. | image | bounding box, polygon, rotatable bounding box |
| Width - Ranks annotated objects by the width of the object. | image | bounding box, polygon, rotatable bounding box |
- Click a Project from the Active home page.
- Click Explorer.
- Click Labels.
- Sort and filter the tabular data.
- Click the plot diagram icon.
- Sort and filter the embedding plot data.
- Click a Project from the Active home page.
- Click Analytics.
- Click Annotations.
- Select the quality metric you want to view from the 2D Metrics view or Metrics Distribution graphs.
Absolute Area
Computes object size in amount of pixels. Implementation on GitHub.Aspect Ratio
Computes aspect ratios (width/height) of objects. Implementation on GitHub.Blue Value
Ranks annotated objects by how blue the average value of the object is. Implementation on GitHub.Brightness
Ranks annotated objects by their brightness. Brightness is computed as the average (normalized) pixel value across each object. Implementation on GitHub.Broken Object Tracks
Identifies broken object tracks by comparing object overlaps based on a running window. Example: If objects of the same class overlap in three consecutive frames (i-1, i, and i+1) but do not share object hash, the frames are flagged as a potentially broken track.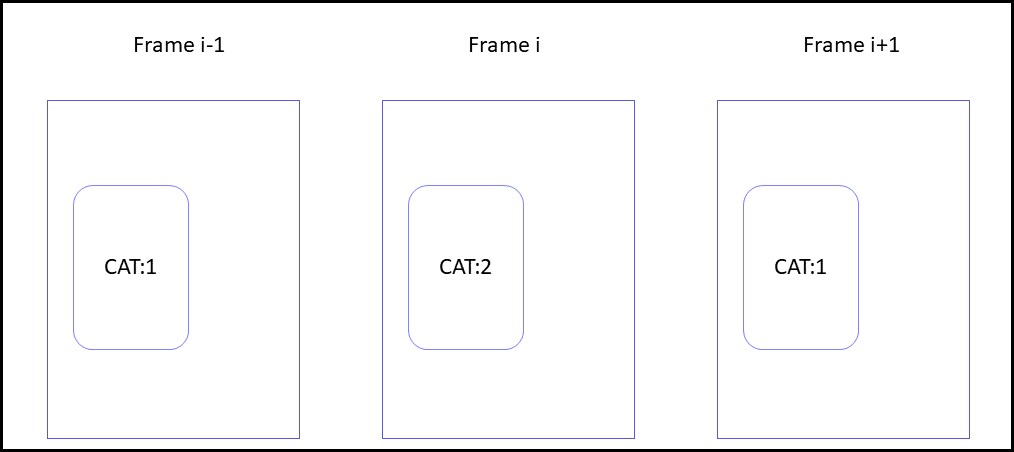
CAT:2 is marked as potentially having a wrong track id.
Implementation on GitHub.
Border Proximity
This metric ranks annotations by how close they are to image borders. Implementation on GitHub.Confidence
The confidence score (α) is a measure of a machine learning model’s certainty that a given prediction is accurate. The higher the confidence score, the more certain a model is about its prediction. Manual labels are always assigned α = 100%, while label predictions created using models and automated methods such as interpolation have a confidence score below 100% (α < 100%). Values for this metric are calculated as labels are fetched from Annotate.While arguably not making much sense when annotated by a human, this value is very important for objects that were automatically labeled.
Contrast
Ranks annotated objects by their contrast. Contrast is computed as the standard deviation of the pixel values. Implementation on GitHub.Classification Quality
This metric creates embeddings from images. Then, these embeddings are used to build nearest neighbor graph. Similar embeddings’ classifications are compared against each other. We calculate the embeddings of each image, (for example, change 3xNxM dimensional images to 1xD dimensional vectors using a neural network architecture). Then for each embedding (or image) we look at the 50 nearest neighbors and compare its annotation with the neighboring annotations. For example, let’s say the current image is annotated as A but only 20 out of 50 of its neighbors are also annotated as A. The rest are annotated differently. That gives us a score of 20/50 = 0.4. A score of 1 means that the annotation is very reliable because very similar images are annotated the same. As the score gets closer to the zero, the annotation is not reliable. Implementation on GitHub.Green Value
Ranks annotated objects by how green the average value of the object is. Implementation on GitHub.Height
Ranks annotated objects by the height of the object. Implementation on GitHub.Inconsistent Object Class
This algorithm looks for overlapping objects in consecutive frames that have different classes. Example: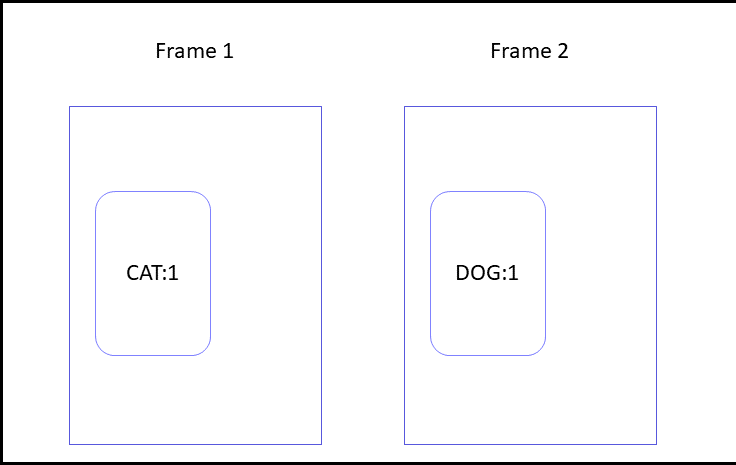
Dog:1 is flagged as potentially the wrong class, because Dog:1 overlaps with CAT:1.
Implementation on GitHub.
Inconsistent Track ID
This algorithm looks for overlapping objects with different track-ids. Overlapping objects with different track-ids are flagged as potential inconsistencies in tracks. Example: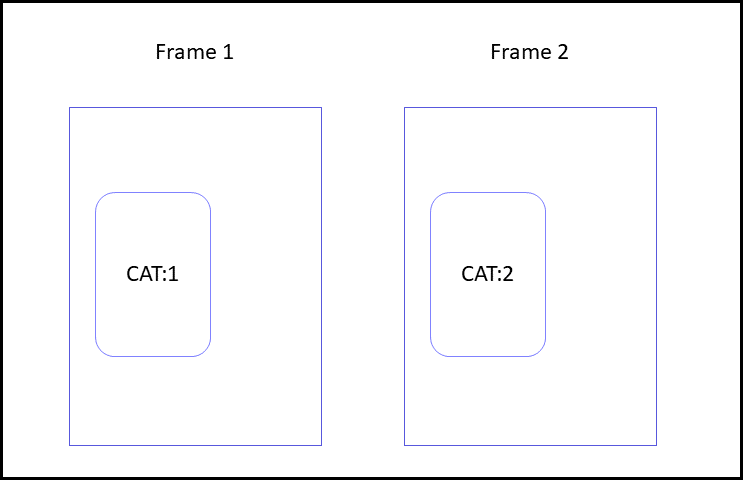
Cat:2 is flagged as potentially having a broken track, because track ids 1 and 2 do not match.
Implementation on GitHub.
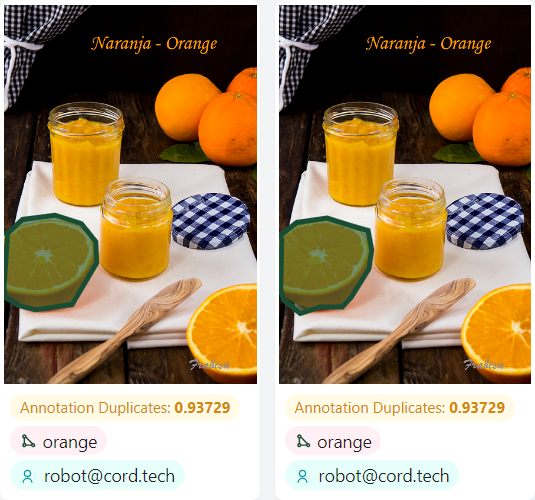
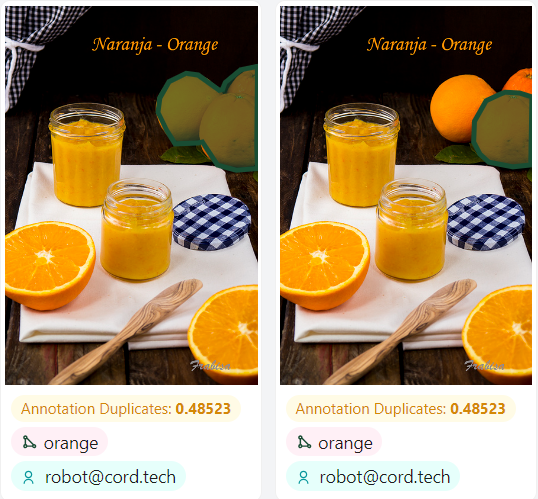
Label Duplicates
Ranks labels by how likely they are to represent the same object.Jaccard similarity coefficient is used to measure closeness of two annotations.Example 1: An annotator accidentally labels the same thing in a frame twice. An annotator labeled the same orange twice in a frame. Look carefully at both images and you can see that there are two slightly different labels around the orange.
 Example 2:
Sometimes the same type of things in a frame are very close to each other and the annotator does not know if the things should be annotated separately or as a group, so they do both. Or perhaps the annotator labels all the things in a group and sometimes they label each individual thing, or they label the group and each individual thing in the group.
An annotator labeled a group of oranges and then labeled individual oranges in the group.
Example 2:
Sometimes the same type of things in a frame are very close to each other and the annotator does not know if the things should be annotated separately or as a group, so they do both. Or perhaps the annotator labels all the things in a group and sometimes they label each individual thing, or they label the group and each individual thing in the group.
An annotator labeled a group of oranges and then labeled individual oranges in the group.
 Implementation on GitHub
Missing Objects
Identifies missing objects by comparing object overlaps based on a running window. Example: If an intermediate frame (frame i) does not include an object in the same region, as the two surrounding frames (i-1 and i+1), the frame is flagged.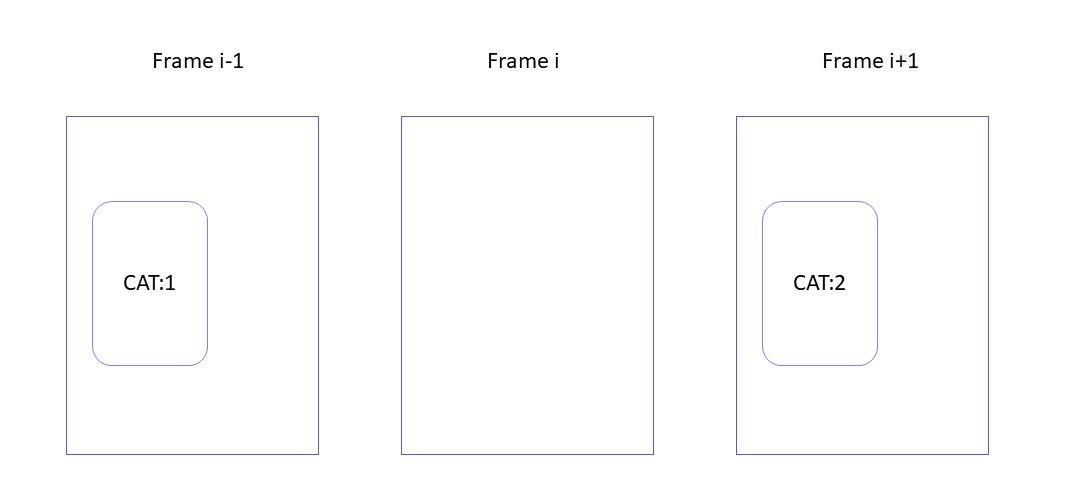 Frame i is flagged as potentially missing an object.
Implementation on GitHub.
Frame i is flagged as potentially missing an object.
Implementation on GitHub.