

- Title: The file name for the frame.
- Selected metric: The data, label, video, or prediction metric the frame is being sorted by.
- Collections: Then number of Collections the frame belongs to. Mousing over the number displays the Collection names.
- Class: The label/classifications in the frame.
- IOU: The Intersection of Union between the prediction labels and ground truth labels. A value of 1 means there is perfect overlap between the prediction and ground truth labels. A value of 0 means there is no overlap between the prediction and ground truth labels.
- Workflow stage: The Workflow stage where the data unit resides.
- Priority: The priority assigned to the task (data unit) in Annotate.
- Show ground truth: Displays ground truth labels on the frame with predictions.
- IOU Threshold: Specifies the value that determines the cutoff between true positive and false positive predictions. Predictions with an IoU greater than or equal to this threshold are considered true positives, while those below it are considered false positives.
- Min Confidence Threshold: Specifies the confidence value to filter your frames with predictions.
Display information on Grid view
The grid is always visible on the left side of the Data Explorer. You can toggle a right-hand panel — Embeddings, Analytics, or Map — using the toolbar icons or keyboard shortcuts. Only one panel is active at a time; click the active icon again to close the panel.The Map panel is not available in the Annotation project Explore view. The Analytics panel is not available in the Curate (shared folder) context.
You can also deep-link directly to a panel by appending
?panel=embeddings, ?panel=analytics, or ?panel=map to the URL. Legacy view-specific URLs redirect automatically and preserve your query parameters.
- Navigate to Data > Explore and select a folder.
-
Use the toolbar icons to toggle the panel you want to display alongside the grid: Embeddings, Analytics, or Map.
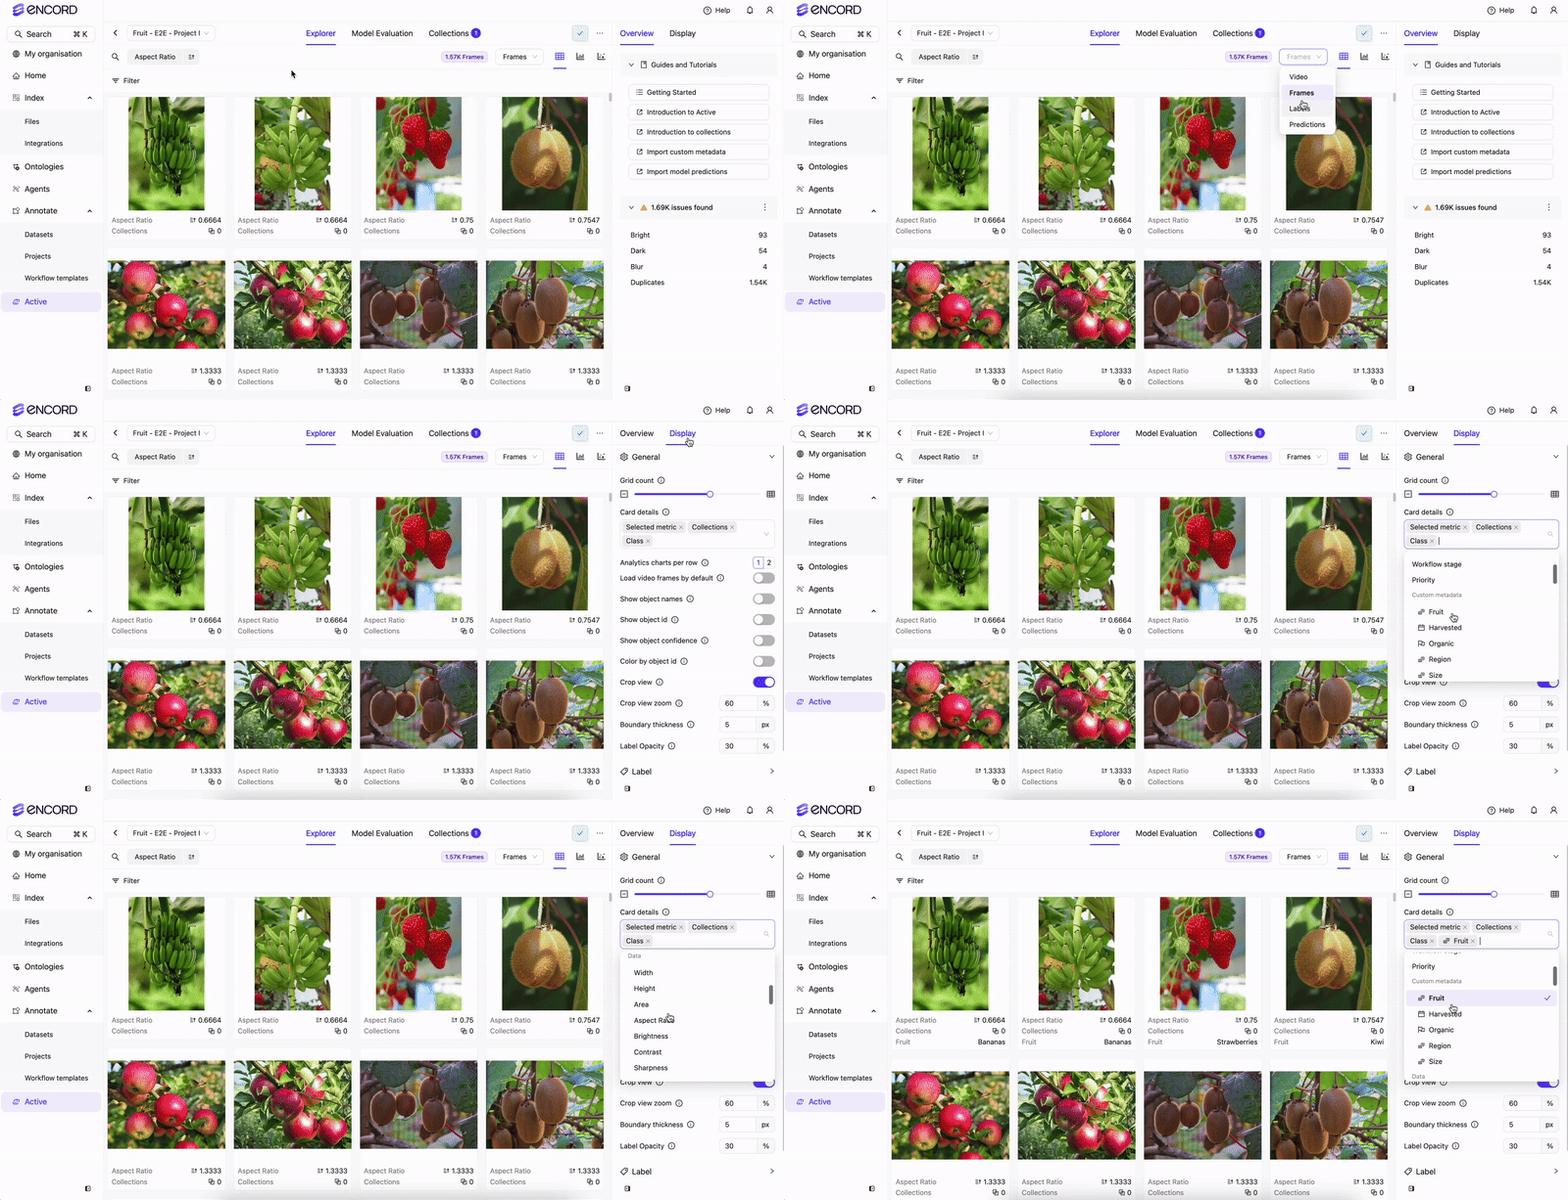
- Click Display on the far right of the screen.
- Specify the data required to display on each card/tile under Card details.
Not all information is available for viewing under every tab (Video, Data, Labels, Prediction).
Embeddings Panel
When you open the Embeddings panel, the scatter plot appears on the right while the grid remains visible on the left. You can draw a selection box on the scatter plot to immediately filter the grid to matching items — without switching views.- Box selection — draw a rectangle on the scatter plot to filter the grid to the selected items. A filter pill appears in the toolbar; dismiss the pill to clear the selection.
- NLS / similarity search — when a similarity search is active, matching points appear in color on the scatter plot and non-matching points appear in gray. This highlighting composes with any active box selection.
- Adding items to collections — use the unified selection toolbar at the bottom of the grid to add or remove selected items from collections. The per-view selection toolbar has been removed; the grid toolbar is the single mechanism for all collection actions.
Hovering over a point in the Embeddings scatter plot no longer shows an image preview tooltip. The grid on the left serves this purpose.
Filter Predictions by IOU and Confidence
- Navigate to Data > Explore and select a folder.
-
Click Predictions.
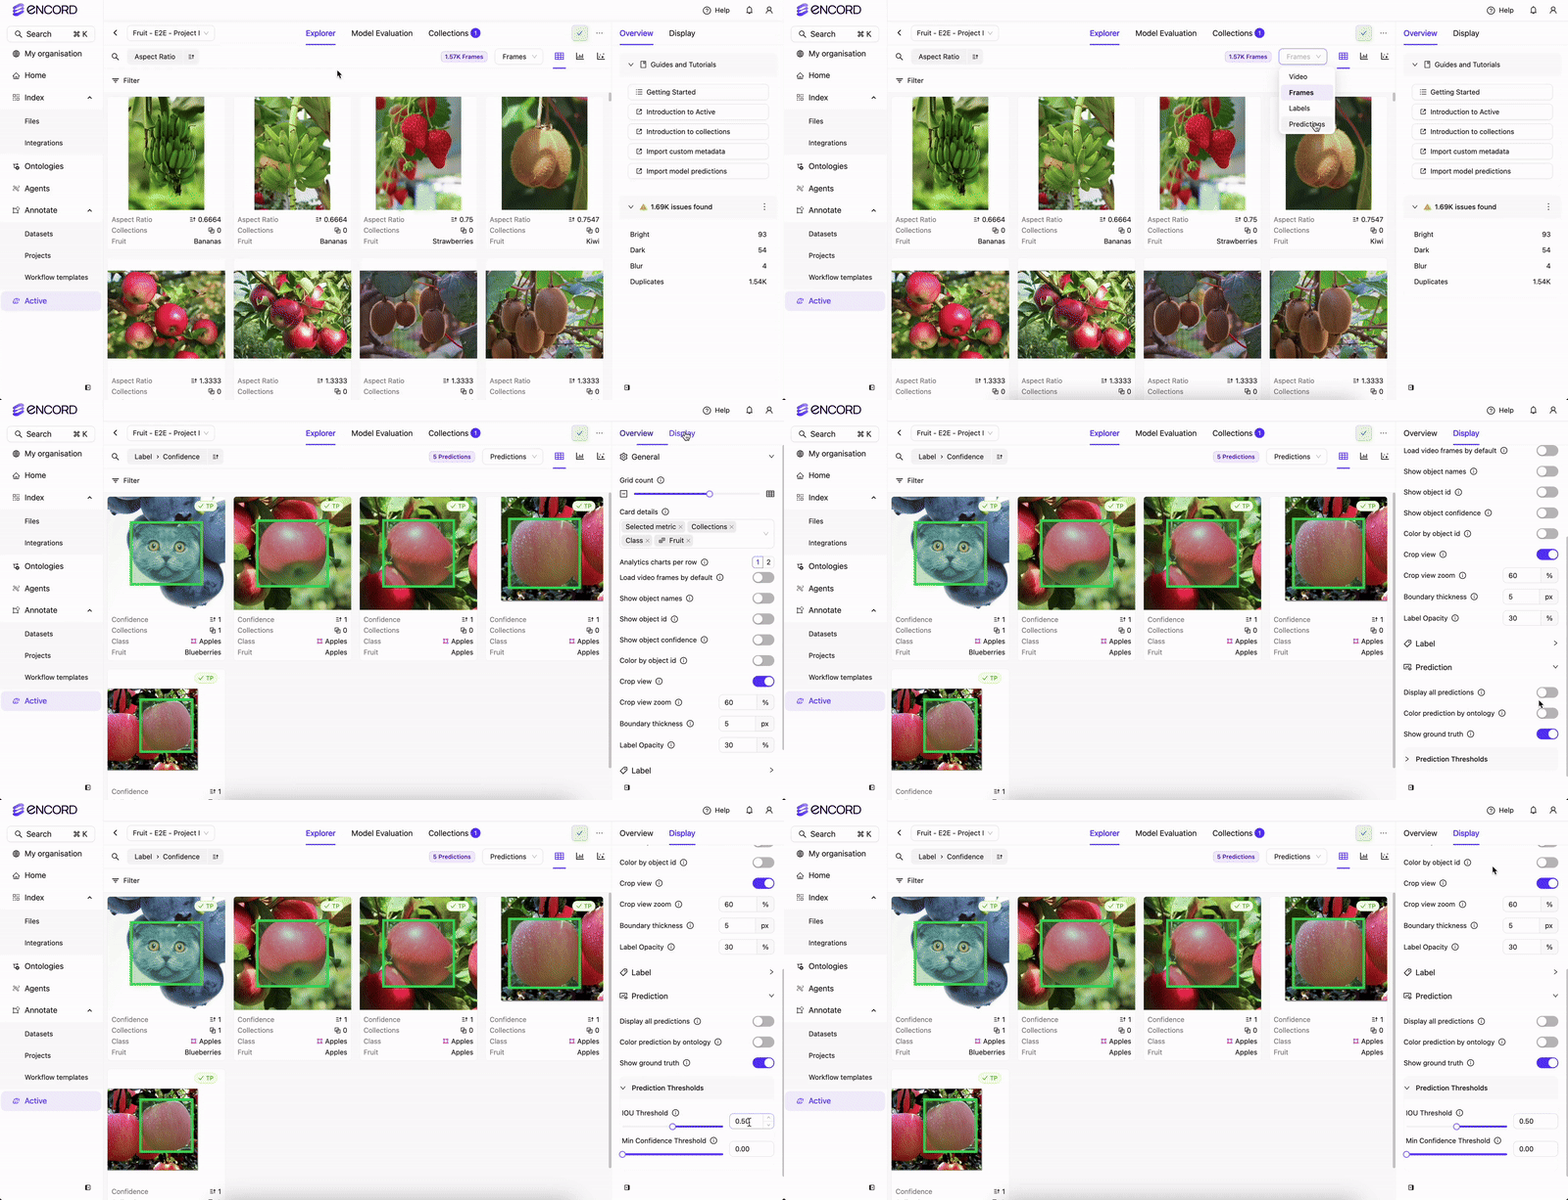
- Click Display on the far right of the screen.
- Expand the Prediction section.
- Adjust the IOU Threshold. Depending on the IOU of the ground truth and prediction labels a TP or FP icon appears on each frame.
- Adjust the Min Confidence Threshold. Frames under the threshold are filtered from view.
Analytics Panel
The Analytics panel opens as a right-hand panel alongside the always-visible grid. Use theV → A keyboard shortcut or the toolbar icon to toggle it.
- Apply to grid — in the Slice Editor, click Apply to grid to copy a slice’s filters into the shared toolbar filter set. The grid updates immediately without navigating away. This button was previously labeled View in Explorer.
- Correlation chart — the View in Explorer context-menu option on the Correlation chart has been removed. Use Apply Filter to apply a filter directly.
- Current Filters chip — the Current Filters editor chip and its popover in the Analytics slice strip are no longer interactive. The chip remains visible as a read-only indicator of the active filter set.
Viewer Role Access
Users with the Viewer role on Workflow projects can now access the Explore tab and browse the Explorer in read-only mode.The Explore tab remains inaccessible for all roles on ManualQA projects. Team Managers see the Explore tab in the navigation but land on the statistics fallback view — this is pre-existing behavior and is unchanged.
- Browse the grid, analytics, and embeddings views
- Apply existing filters and collections
- Post comments and raise issues
- Create, edit, or delete collections
- Add or remove items from collections (collection tags remain visible in item previews)
- Create, edit, delete, or save filter presets
- Import or delete prediction sets (Manage button is hidden)
- Use bulk actions (priority, bulk classify, change class, delete labels, export CSV)
Item Preview Sidebar
When you open an item’s preview sidebar, the Objects and Classifications panels now display the values entered for text and numeric annotation attributes directly inline — without needing to open the full annotation editor.- Text attributes — free-form text answers (for example, captions or notes) appear beneath their parent object or classification.
- Numeric attributes — numeric answers (for example, scores or counts) appear beneath their parent object or classification.
- Long text values — values that exceed the available width are truncated with an ellipsis (
…). Hover over the truncated value to see the full text in a tooltip. - Empty attributes — if no value has been entered for an attribute, the sidebar displays
NA.
This applies to both the Objects and Classifications panels in the sidebar. Radio button and checklist attribute selections continue to display as expandable child nodes, as before.
Filter by Custom Metadata
To filter the grid by a custom metadata value, expand File Metadata in a Project’s Explore tab, or expand File Metadata or Frame Metadata in Data > Explore. Hover over the metadata row and click the funnel icon. Encord adds an exact-match filter to your existing filters, closes the preview, and displays the filtered grid. You can also focus the row with your keyboard to reveal the button. The filter button is unavailable for:- Children Metadata in data groups
- Geospatial and embedding metadata
- Null or undefined values
- String and text values longer than 12 words