> ## Documentation Index
> Fetch the complete documentation index at: https://docs.encord.com/llms.txt
> Use this file to discover all available pages before exploring further.
# Time Series
Time series is in Beta. Contact your Encord support representative to enable the feature for your Organization.
Time series data lets you import a CSV file and view its columns as charted channels in the Label Editor timeline.
 ## Supported Files
Time series data currently supports CSV files with a MIME type of `text/csv` or `application/csv`.
Each file must contain a header row, at least one timestamp column, and at least one channel column.
```csv Example theme={"dark"}
time_ms,acc_x,acc_y,acc_z
0,0.12,0.02,0.98
100,0.18,0.03,1.01
200,0.15,0.01,0.99
```
### Columns structure
Time series CSV validation and parsing happen when the file is opened in the Editor. Encord makes the following assumptions about your CSV:
* The timestamp column is the first column whose header starts with `t`, `time`, or `timestamp`. If no matching header exists, Encord uses the first column.
* Timestamp headers can include a unit suffix, such as `time_ns`, `time_us`, `time_ms`, `time_s`, or `time_iso`. If the timestamp unit cannot be inferred, numeric timestamps are treated as frame-like values.
* Every non-timestamp column is treated as a channel and plotted in the timeline.
* Empty, `NaN`, `null`, or otherwise non-numeric channel values are treated as gaps.
* Rows without a valid timestamp are skipped.
These assumptions are temporary and in the future be optionally specified at upload time.
## Register Time Series Data
Register time series CSV files with the `time_series` top-level key in your upload JSON.
```json Time series upload JSON theme={"dark"}
{
"time_series": [
{
"objectUrl": "s3://my-bucket/sensors/session-001.csv",
"title": "Session 001 telemetry",
"clientMetadata": {
"vehicle": "A-17",
"route": "north-loop"
}
}
]
}
```
Then register the JSON file through the existing data registration flow:
* UI: [Manual Data Registration](/platform-documentation/Curate/add-files/index-register-cloud-data)
* SDK: [Import/Register Data](/sdk-documentation/getting-started-sdk/sdk-register-data)
## Annotating Time Series Data
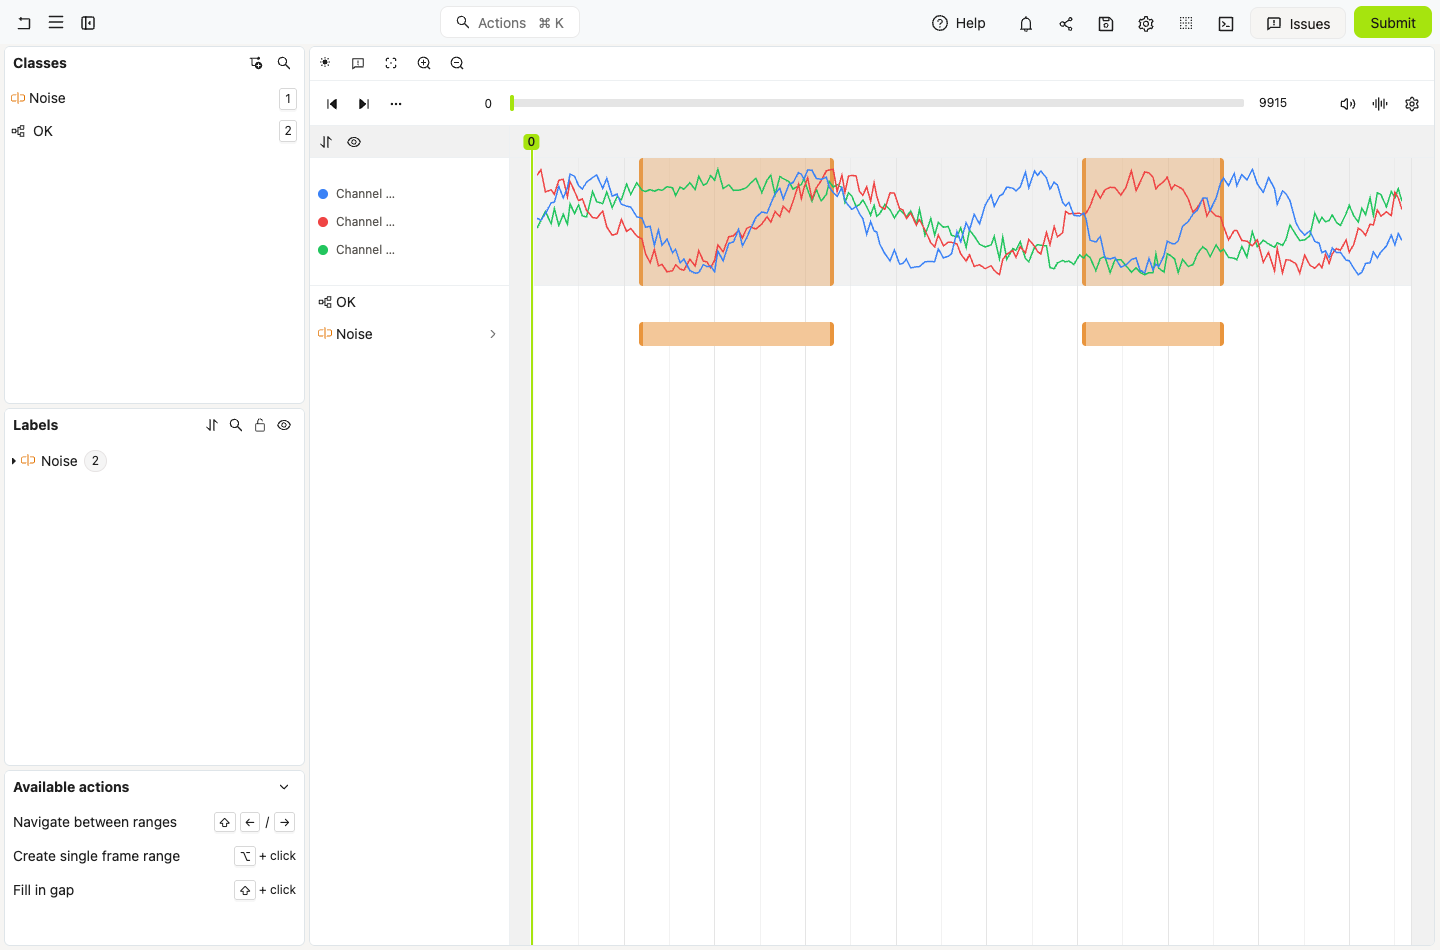
Open a time series task in the Label Editor. The timeline displays the channels above the annotation rows. Annotators can use the chart as context while creating and reviewing time range labels.
To label intervals on a time series file, add a **Time range** object to your Ontology. Time range labels appear on the timeline and can be used to mark events, anomalies, or segments of interest.
The chart supports multiple channels. Channels are color-coded, and the timeline view can show time range labels below the chart. Time series uses the same timeline annotation interactions as other temporal modalities:
1. Select the **Time range** class.
2. Create a range on the timeline for the event or segment you want to label.
3. Adjust the range boundaries as needed.
4. Submit the task when all required labels are complete.
### Customize Time Series Channels
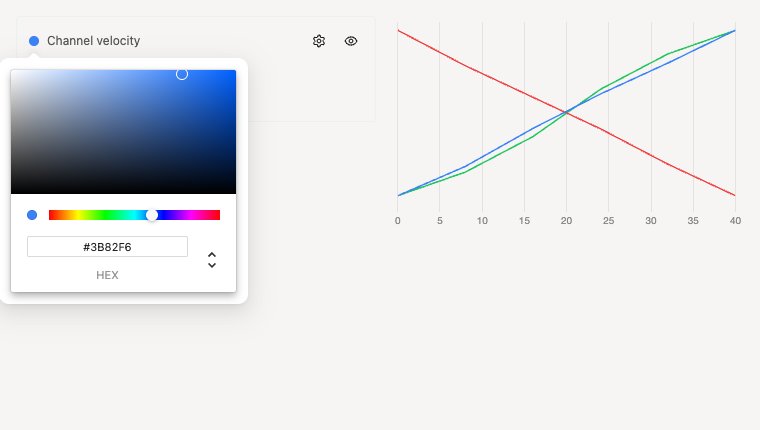
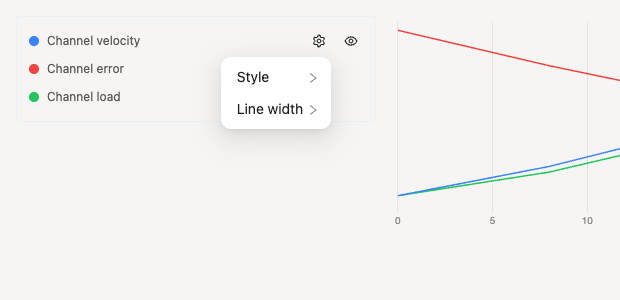
Use the channel controls in the timeline to adjust how each CSV channel appears in the chart.
You can:
* Hide or show individual channels.
* Set a custom channel color.
* Change the channel style between line and points.
* Resize the channel by changing line width or point size.
Customization of channel appearances is currently only possible while opening the time series in the editor, but will be possible at upload time in the future.
## Supported Files
Time series data currently supports CSV files with a MIME type of `text/csv` or `application/csv`.
Each file must contain a header row, at least one timestamp column, and at least one channel column.
```csv Example theme={"dark"}
time_ms,acc_x,acc_y,acc_z
0,0.12,0.02,0.98
100,0.18,0.03,1.01
200,0.15,0.01,0.99
```
### Columns structure
Time series CSV validation and parsing happen when the file is opened in the Editor. Encord makes the following assumptions about your CSV:
* The timestamp column is the first column whose header starts with `t`, `time`, or `timestamp`. If no matching header exists, Encord uses the first column.
* Timestamp headers can include a unit suffix, such as `time_ns`, `time_us`, `time_ms`, `time_s`, or `time_iso`. If the timestamp unit cannot be inferred, numeric timestamps are treated as frame-like values.
* Every non-timestamp column is treated as a channel and plotted in the timeline.
* Empty, `NaN`, `null`, or otherwise non-numeric channel values are treated as gaps.
* Rows without a valid timestamp are skipped.
These assumptions are temporary and in the future be optionally specified at upload time.
## Register Time Series Data
Register time series CSV files with the `time_series` top-level key in your upload JSON.
```json Time series upload JSON theme={"dark"}
{
"time_series": [
{
"objectUrl": "s3://my-bucket/sensors/session-001.csv",
"title": "Session 001 telemetry",
"clientMetadata": {
"vehicle": "A-17",
"route": "north-loop"
}
}
]
}
```
Then register the JSON file through the existing data registration flow:
* UI: [Manual Data Registration](/platform-documentation/Curate/add-files/index-register-cloud-data)
* SDK: [Import/Register Data](/sdk-documentation/getting-started-sdk/sdk-register-data)
## Annotating Time Series Data
Open a time series task in the Label Editor. The timeline displays the channels above the annotation rows. Annotators can use the chart as context while creating and reviewing time range labels.
To label intervals on a time series file, add a **Time range** object to your Ontology. Time range labels appear on the timeline and can be used to mark events, anomalies, or segments of interest.
The chart supports multiple channels. Channels are color-coded, and the timeline view can show time range labels below the chart. Time series uses the same timeline annotation interactions as other temporal modalities:
1. Select the **Time range** class.
2. Create a range on the timeline for the event or segment you want to label.
3. Adjust the range boundaries as needed.
4. Submit the task when all required labels are complete.
### Customize Time Series Channels
Use the channel controls in the timeline to adjust how each CSV channel appears in the chart.
You can:
* Hide or show individual channels.
* Set a custom channel color.
* Change the channel style between line and points.
* Resize the channel by changing line width or point size.
Customization of channel appearances is currently only possible while opening the time series in the editor, but will be possible at upload time in the future.